
It’s usually the first thing a growth or ecommerce lead notices on an international dashboard: the UK site converts at one rate, and Germany, Korea, or the UAE converts at something noticeably lower. The instinct is to treat it as one problem with one answer, usually “the marketing isn’t landing” or “the price positioning is off.” In practice it’s rarely one thing. It’s a small stack of frictions that compound, and most teams only ever check the one or two that are easiest to see.
This is a working order to check them in, roughly from “the journey doesn’t work at all” through to “the journey works but underperforms,” because that order tells you something important: the earlier causes on this list usually cost you more conversion, and they’re usually cheaper to fix, because fixing them is finding and removing something broken rather than running experiments to improve something that already works.
Defects: does the journey actually work in that market?
A broken journey doesn’t show up in analytics as “low conversion.” It shows up as a hard stop a UK shopper would never hit. Baymard’s checkout research found that strict password rules alone can push abandonment up to 19% among shoppers who already have an account and get stuck signing in, and that 94% of sites don’t use adaptive validation, so an error just says something’s wrong without saying what, leaving the shopper to guess or give up.
Most internal QA happens from a UK office, on UK infrastructure, with UK test cards, a UK address in the test data, and a UK phone running none of the apps a real shopper in that market would actually have installed. That setup will never surface a defect that only appears on a Korean mobile network, with a Korean phone, a Korean address format, local social media, and messaging apps like KakaoTalk installed, and a payment method that isn’t tested because nobody on the internal team has one to test with. This is the most basic check on this list, and the one most commonly skipped, because it means testing with real devices and real local conditions from that market, not just guessing what the ideal local conditions might be as an outsider, or hoping that a single tester can know all the local conditions perfectly by themselves.
The scale this can reach at the extreme end is well documented. When Target expanded into Canada in 2013, its inventory systems were adapted from the US setup rather than built and tested for Canadian conditions: they couldn’t handle the Canadian dollar or French-language characters, and stores ended up checking data by hand. Target exited less than two years later, having lost an estimated $2 billion. Most teams won’t get it that wrong today, but the underlying mistake, treating a new market as a smaller version of the one you already know, is the same one behind a checkout that was only ever tested in English, in pounds, from a UK IP address.
Payment mix: are you asking shoppers to pay in a way they don’t use?
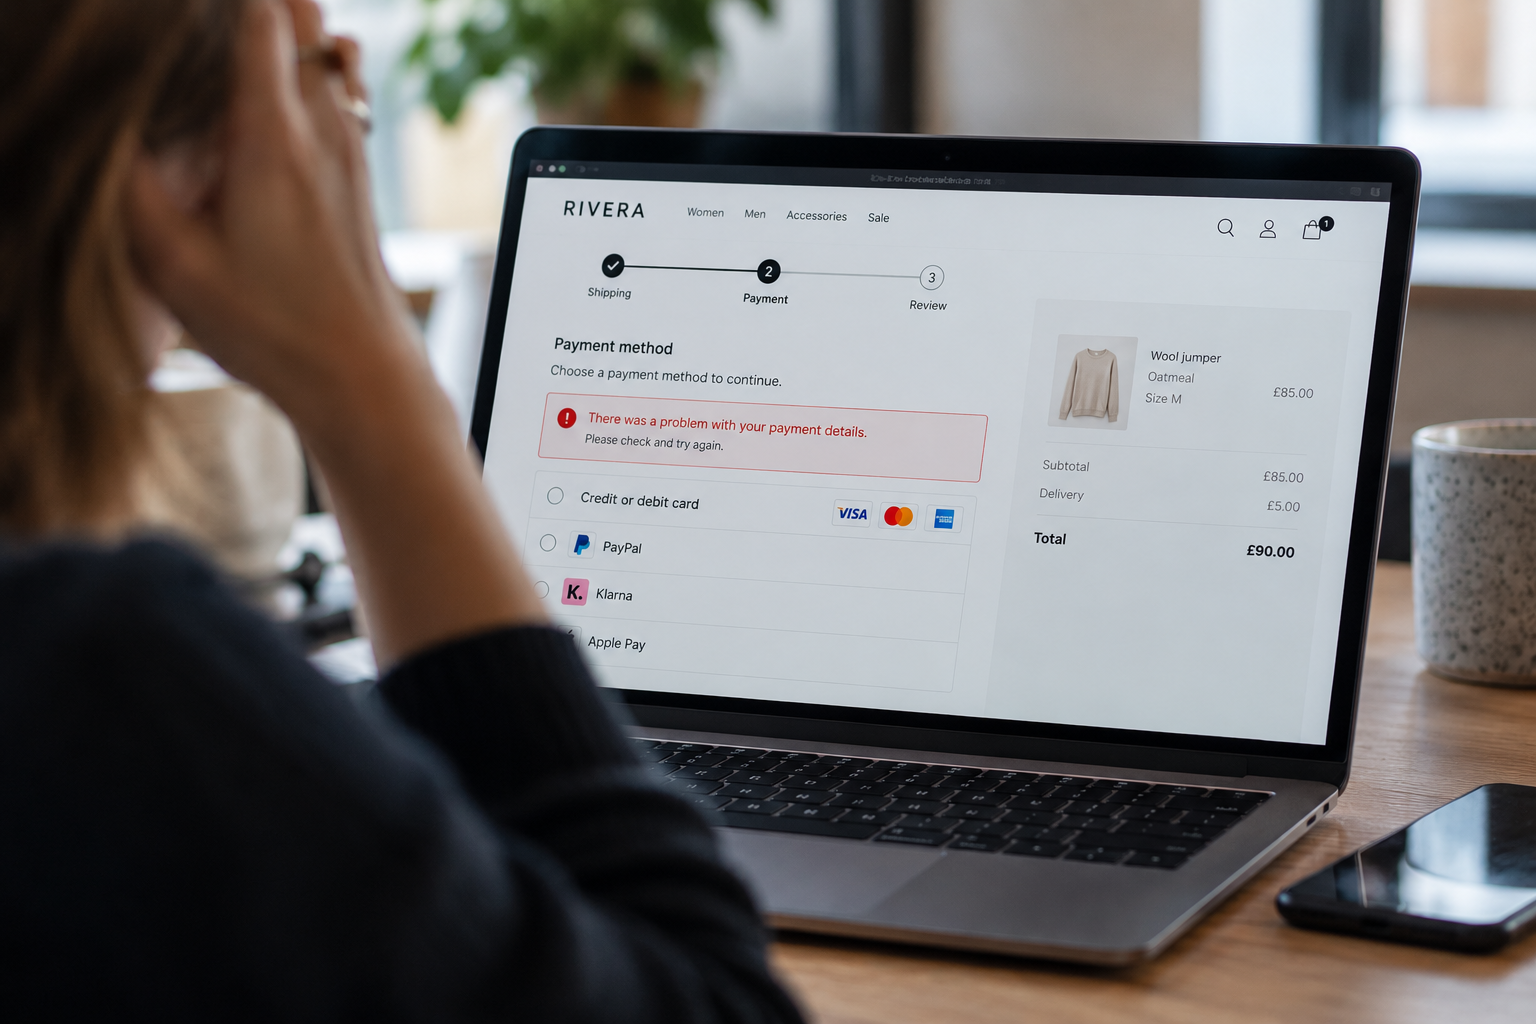
This is where a lot of “low conversion” is actually “no viable way to pay.” Cross-border research cited by PPRO found that 94% of cross-border shoppers expect to pay in their own currency and 99% want to use their preferred payment method, and that 72% of merchants see higher payment failure rates on overseas transactions than domestic ones. Failed payments are estimated to cost online retailers up to 11% of potential sales, and around 19% of shoppers abandon at the final checkout step specifically because a payment method is missing or the process is too complicated.
In some markets this isn’t even about preference. In parts of Latin America, for example, a large share of cards are only set up to work for domestic transactions, so a shopper can have a valid, working card and still be unable to pay a UK retailer. None of this shows up cleanly in UK-based analytics. It just looks like checkout abandonment, with no obvious cause.
Stripe’s own data on this is stark: switching on the right local payment method lifted conversion by 91% in China with Alipay, 46% in Poland with BLIK, and 39% in the Netherlands with iDEAL, far above the 7.4% average lift it found across all markets and methods combined. The gap between offering “a payment method” and offering the right one for that market is the difference between those two numbers.
This is where payment testing across real devices, local payment methods and markets can help uncover barriers that UK-based testing might miss.

Delivery expectations: does the promise match what’s normal there?
High delivery fees and long or unclear wait times are enough on their own to end a sale, according to cross-border shopper research, and Baymard’s checkout benchmark shows why the detail matters: 48% of sites show a delivery speed instead of an actual delivery date, and 83% show a static cutoff time instead of a countdown, both of which force the shopper to do the maths themselves. Get that maths wrong, show a cutoff in the wrong time zone, or quote “3 to 5 working days” without accounting for local public holidays, and the order arrives later than promised, which damages trust for the next purchase even if this one completed.
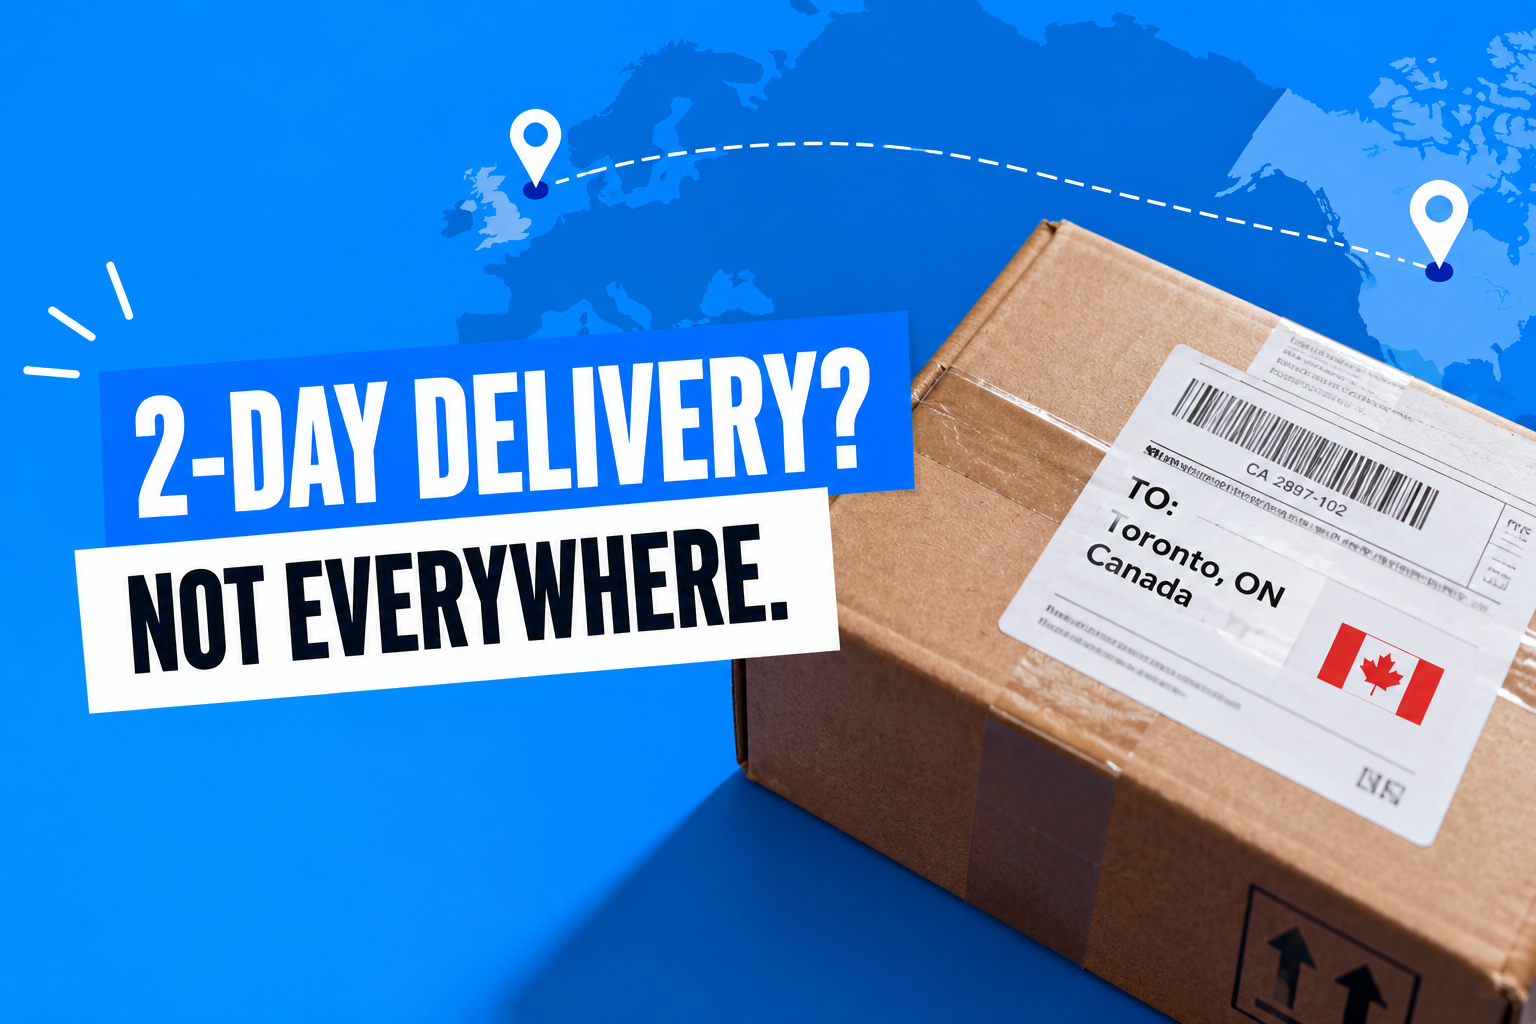
When a leading UK retailer expanded into Canada, they hadn’t accounted for the difficulty of meeting their two-day delivery promise in remote locations such as Beaver Creek, Old Crow and Keno City in the Yukon. For these areas, delivery expectations needed to be four days or more.
Local UX: does the page actually make sense to someone browsing it in their own context?
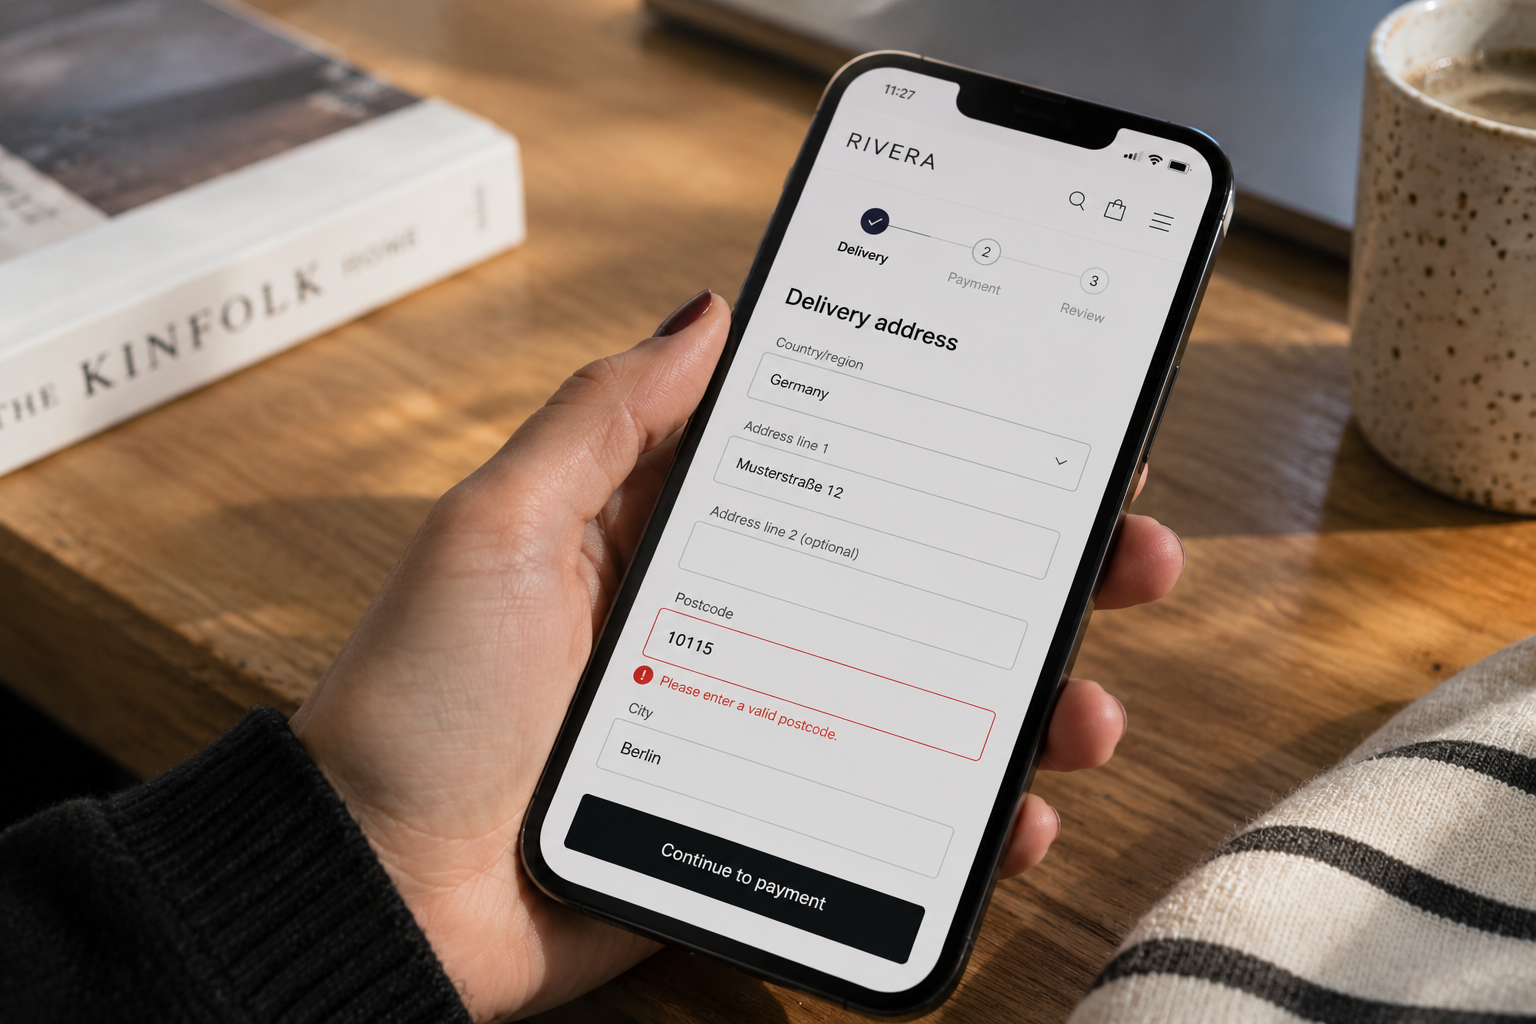
This is where small, specific friction lives. Baymard’s research includes a German retailer whose address form used radio buttons labelled only in German and English side by side, which most shoppers found hard to scan, and a UK retailer that rejected a phone number because it contained a space, with no indication of whether a country prefix was expected. Individually these look minor. Repeated across a checkout form built around one country’s conventions (postcodes, address structure, phone formats), they add up to a journey that technically loads but doesn’t quite work.
Address data alone is a well-measured cost once it’s wrong: Gartner estimates poor data quality costs organisations an average of $12.9 million a year, and address errors are linked to as much as 41% of failed first-attempt deliveries industry-wide. A form that doesn’t match the postcode, address or phone format a market actually uses isn’t a cosmetic issue, it’s the first domino in that chain.
This is where localisation testing helps identify the regional differences that UK-based testing can miss, from address formats and validation rules to how customers actually navigate and use a site.
Content accuracy: is what’s actually on the page still correct?
Content errors are an old problem, not a new one. KFC’s “finger lickin’ good” was famously rendered in Chinese as something closer to “eat your fingers off,” and it took a local team to catch it. The modern version of that mistake isn’t usually a slogan, it’s a promotional banner or a checkout label that quietly goes wrong as a page changes, with nobody local reviewing it before it ships.
That’s the pattern worth watching for: content that was accurate once but hasn’t been checked since, promotional content that stops matching local stock or delivery promises, and currency or pricing that displays inconsistently. We’ve covered what to actually test for translation and localisation accuracy in detail in Best Localisation Testing Services for Ecommerce Teams, so rather than repeat that here, the short version for this piece: content accuracy is one layer of the problem, not the whole of it, and it’s usually the layer teams check first and the one that’s easiest to partially fix with a translation pass, while the defects, payment mix and delivery issues above it stay untouched as they are harder to identify.
Is this a testing problem or an optimisation problem?
Worth separating these before spending budget on either. A testing problem is something broken or missing for that market: a defect, a payment method that isn’t offered, a form that silently rejects valid input, content that’s simply wrong. The fix is finding it and removing it, not running experiments to improve around it. An optimisation problem is different: the journey works end to end, nothing is broken, but it still underperforms, weaker copy, a less compelling offer, a checkout flow that could convert better even though it functions correctly. That’s CRO territory, and it needs experimentation, not a bug fix.
A rough rule of thumb: if a shopper in that market can’t complete the journey at all, or hits something a UK shopper never would, that’s a testing problem. If the journey completes and still converts lower than you’d expect once the blockers above are cleared, that’s optimisation. Most underperforming international sites have some of both, but testing problems are worth finding and fixing first. No amount of CRO experimentation will improve a checkout that’s actually broken for that market, it’ll just optimise the page shoppers are abandoning before they reach it.
Where Digivante fits
Digivante tests the real customer journey in-market, with real users, on real devices, which is how most of the defects, payment failures and broken forms above actually get found, the things that look like low conversion in a dashboard but are really a blocker nobody’s seen because nobody tested it from that market. That’s useful on its own.
Where it’s different is what happens with what’s found. Every test looks at commercial impact as well as whether something’s technically broken, so findings come back prioritised by what’s actually costing conversion, not as a defect list in order of severity. That’s closer to what a growth or ecommerce lead actually needs: not “here are 40 bugs,” but “here’s what’s actually costing you conversion in Germany, and here’s what to fix first.”
We’ve seen that play out directly. For Micheldever Tyre Services’ TyreClick platform, a Digivante heuristic and usability study flagged the checkout page as the priority fix, and basket-to-completion conversion rose from 27% to 37% within six months of acting on it, with upsell sales up 19% year on year (full case study). That’s the shape of answer this is about: not a list of defects, but a specific page to fix and a measurable reason to fix it.
If you want a read on what’s actually costing conversion in a specific market, talk to us.